Since visNetwork_0.2.1, it’s possible to make the link between the features of package igraph and those of visNetwork :
Use igraph layout
With visIgraphLayout(), you can use all available layouts in igraph and calculate coordinates before the sending to vis.js :
nnodes <- 100
nnedges <- 200

nodes <- data.frame(id = 1:nnodes)
edges <- data.frame(from = sample(1:nnodes, nnedges, replace = T),
                    to = sample(1:nnodes, nnedges, replace = T))

# with defaut layout
visNetwork(nodes, edges, height = "500px") %>%
  visIgraphLayout() %>%
  visNodes(size = 10)
# in circle ?
visNetwork(nodes, edges, height = "500px") %>%
visIgraphLayout(layout = "layout_in_circle") %>%
visNodes(size = 10) %>%
visOptions(highlightNearest = list(enabled = T, hover = T),
nodesIdSelection = T)Use igraph network
visIgraph directly transforms an igraph network into a visNetwork. It’s a little bit experimental (not perfect). You can also use toVisNetworkData to just get data into visNetwork format :
library("igraph", quietly = TRUE, warn.conflicts = FALSE, verbose = FALSE)
igraph_network <- graph.famous("Walther")

plot(igraph_network)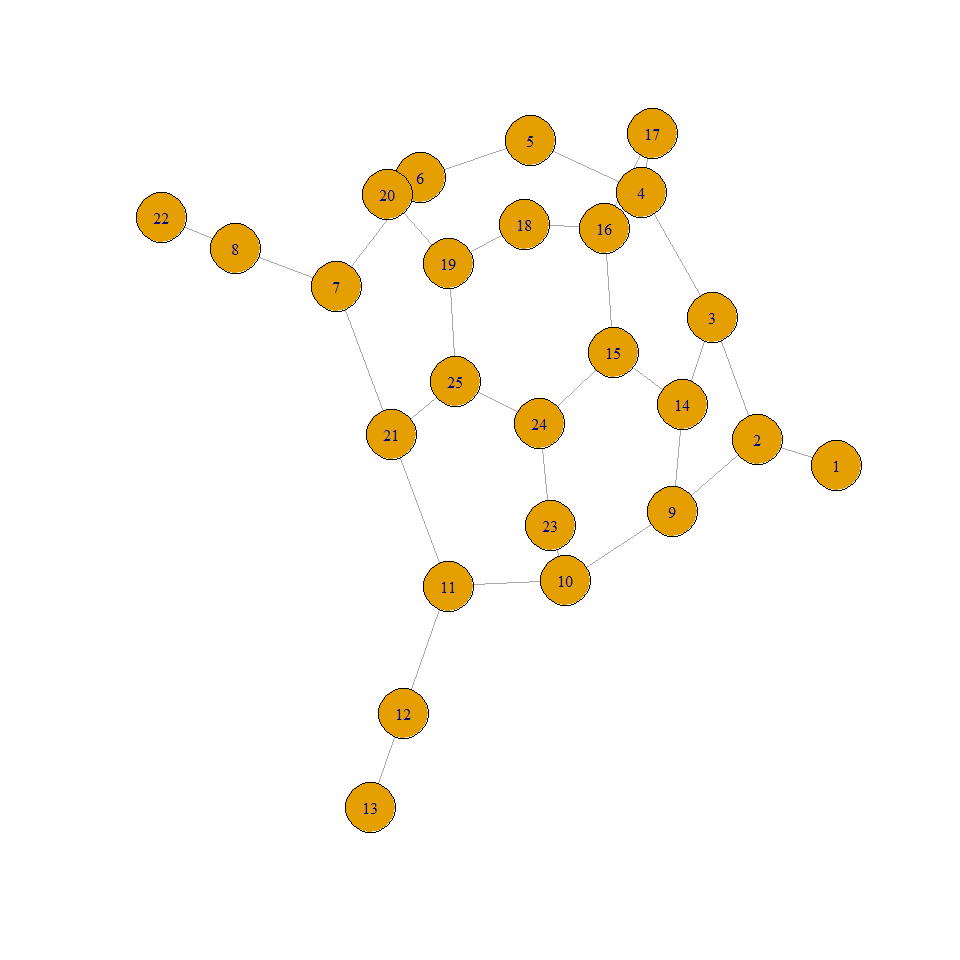
# get data and plot :
data <- toVisNetworkData(igraph_network)
visNetwork(nodes = data$nodes, edges = data$edges, height = "500px")
# or plot directly
visIgraph(igraph_network)