Basic use
You can easily include charts in your shiny apps with the functions amChartsOutput(outputId) and renderAmCharts(expr).
require(shiny)

shinyApp(
  ui = fluidPage(amChartsOutput(outputId = "amchart")),

  server = function(input, output) {
    output$amchart <- renderAmCharts({
      # minimal example
      iris <- get(x = "iris", pos = "package:datasets")

      amBoxplot(iris[, -5])
    })
  }
)
Shiny interactions
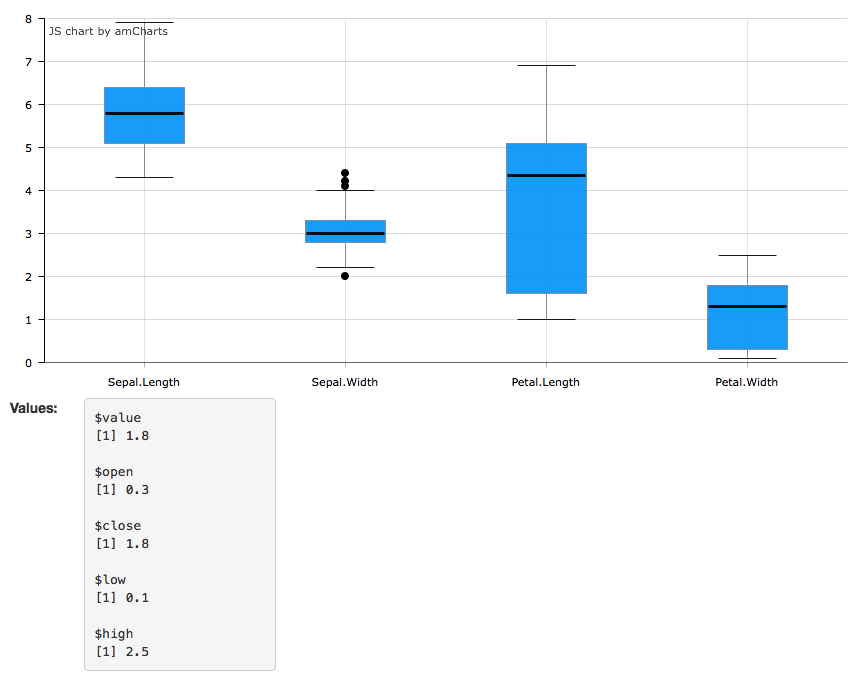
Moreover, you can get the result from a click by adding a listener to you graph. For doing this we use the function addListener(.Object, name, expression). The argument ‘name’ is the event which trigger the event, in this case clickGraphItem detect a click on the chart values. The argument expression is a character string corresponding to a JS function:
function (event) {
  Shiny.onInputChange('myValues', event.item.values);
}
It is define a new input with the id=‘myValues’, for which the result sent to the server are the chart values at the click.
require(shiny)

shinyApp(
  ui = fluidPage(
    amChartsOutput(outputId = "amchart"),
    fluidRow(
      column(width = 1, strong("Values: ")),
      column(width = 3, verbatimTextOutput("click"))
    )
  ),

  server =  function(input, output) {
    output$amchart <- renderAmCharts({
      # build the chart
      pipeR::pipeline(
        amBoxplot(iris[, -5]),
        addListener(name = 'clickGraphItem',
                    expression = paste('function (event) {',
                                       'Shiny.onInputChange(\'myValues\', event.item.values);',
                                       '}'))
      )
    })

    output$click <- renderPrint(input$myValues)
  }
)